Gold Corrects as Yields Surge: XAU/USD Tests Critical $4,600 Support
Executive Summary
- Intraday Correction: Gold (XAU/USD) has retraced -1.02% from its daily high of $4,673.78, currently hovering near the session low of $4,608.92.
- Yield Pressure: A resurgence in US 10-Year Treasury yields to 4.75% is countering the geopolitical risk premium traditionally afforded by Middle East tensions.
- Focus on Jackson Hole: Market participants are pivoting toward the upcoming Jackson Hole symposium, looking for Fed Chair Kevin Warsh to clarify the trajectory of US monetary policy.
Technical & Fundamental Breakdown
Fundamental Context: The Treasury/Bullion Tug-of-War
Gold’s parabolic momentum, which saw it breach the $4,700 handle earlier this month, has encountered significant friction. The primary headwind is the US Treasury’s strategic shift. While Secretary Scott Bessent’s expansion of bond buybacks initially provided a liquidity cushion, the subsequent rise in 10-year yields to 4.75% has increased the opportunity cost of holding non-yielding bullion.
Despite “contained” CPI and PPI prints suggesting easing energy-linked inflation, the market remains on edge regarding the “Warsh Fed.” With a one-in-three chance of a September rate hike still priced in, gold is struggling to sustain its premium. Geopolitical “tail risks” involving Iran remain the primary floor for the market, preventing a deeper liquidation toward the $4,500 zone.
Technical Analysis: Corrective Phase or Trend Reversal?
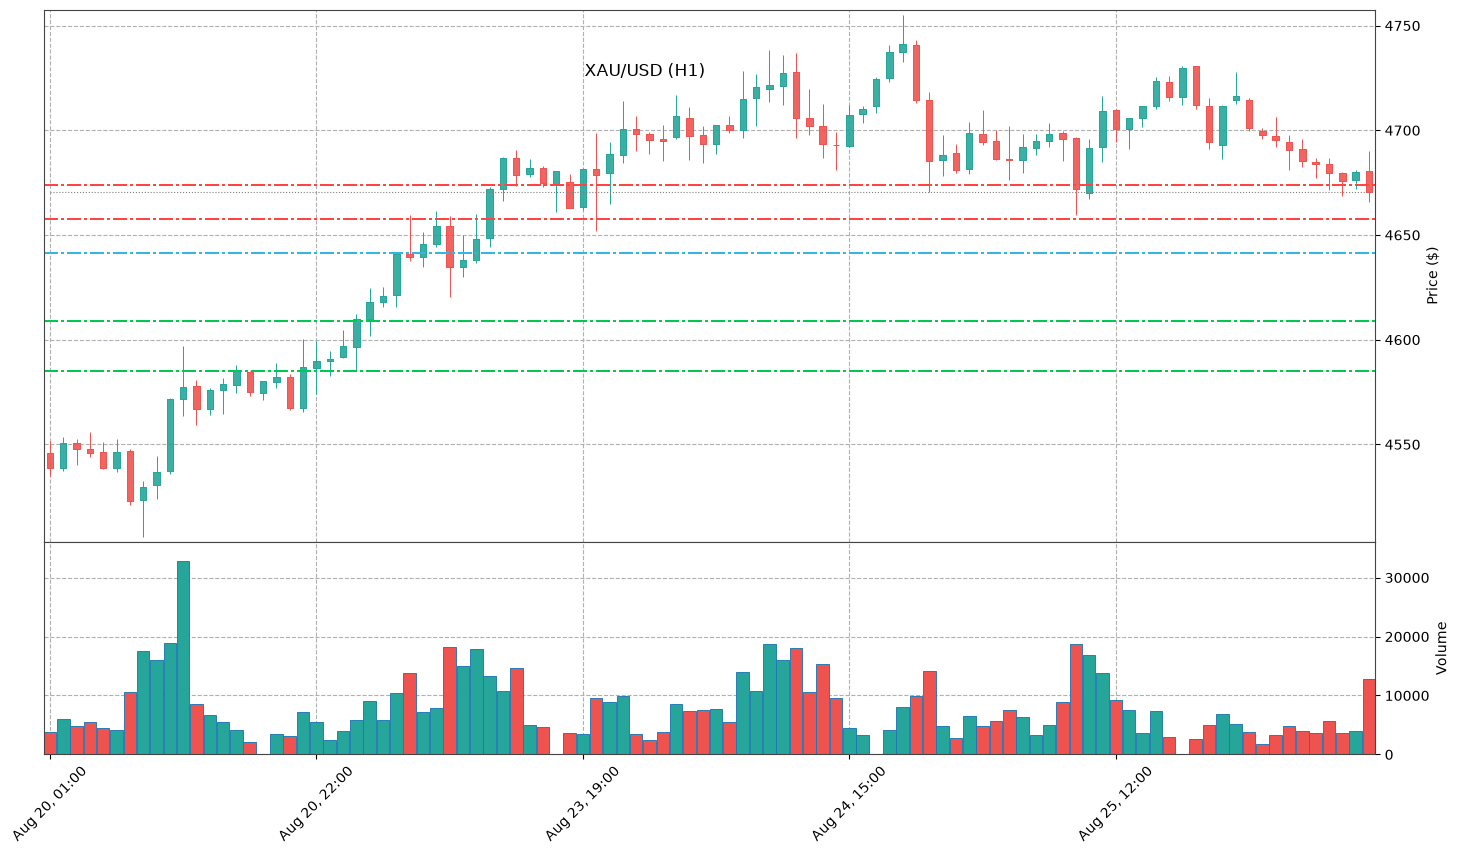
Technically, XAU/USD is currently in a corrective phase following a failed attempt to consolidate above the $4,650 level. The price action over the last 8 hours shows a steady series of lower highs.
The $4,608.92 mark (today’s low) is the immediate “line in the sand.” A breach here suggests a test of the psychological $4,600 support. The 24-hour range ($4,608.92 - $4,673.78) indicates that volatility is expanding, likely due to the liquidations of late-entry long positions.
Key Technical Levels
- Resistance 2 (R2): $4,673.78 (Daily High / Overbought Boundary)
- Resistance 1 (R1): $4,657.75 (Previous Close / Structural Pivot)
- Support 1 (S1): $4,608.92 (Intraday Low)
- Support 2 (S2): $4,585.00 (Trendline Support)
The “4-Hour Edge”
Outlook: Bearish/Neutral
For the next four hours, the bias remains tilted to the downside. The failure of the bid at $4,610 suggests that buyers are stepping back to wait for a deeper discount or more clarity from the US economic calendar. We expect a period of consolidation with a negative bias as the market attempts to find a base near $4,600. Unless a fresh geopolitical headline crosses the wires, the path of least resistance is a slow drift toward the $4,605 support level.
- Trade Strategy: Short-term sellers may look for entries on minor rallies toward $4,625, targeting $4,600. Longs should remain sidelined until a bullish engulfing pattern appears on the 1-hour timeframe near the S1 level.
Disclaimer: This analysis is for informational purposes only and does not constitute financial advice. Trading precious metals involves significant risk of loss. Always perform your own due diligence before entering any market position.
