Gold Smashes $4,600 Ceiling: Safe-Haven Demand Intensifies Amid Geopolitical Friction
Executive Summary
- Bullish Breakout Confirmed: XAU/USD has decisively cleared the $4,600 psychological resistance, surging +1.53% in the last 24 hours to hit a three-month peak.
- Macroeconomic Tailwinds: A weakening US Dollar (DXY falling below 99.00) and escalating Middle East tensions are driving aggressive safe-haven inflows, overshadowing resilient US services data.
- Treasury Dynamics: New signals from the US Treasury regarding expanded bond buybacks are suppressing long-term yield volatility, providing a fertile environment for non-yielding assets like Gold.
Technical & Fundamental Breakdown
Technical Analysis: The Momentum Play
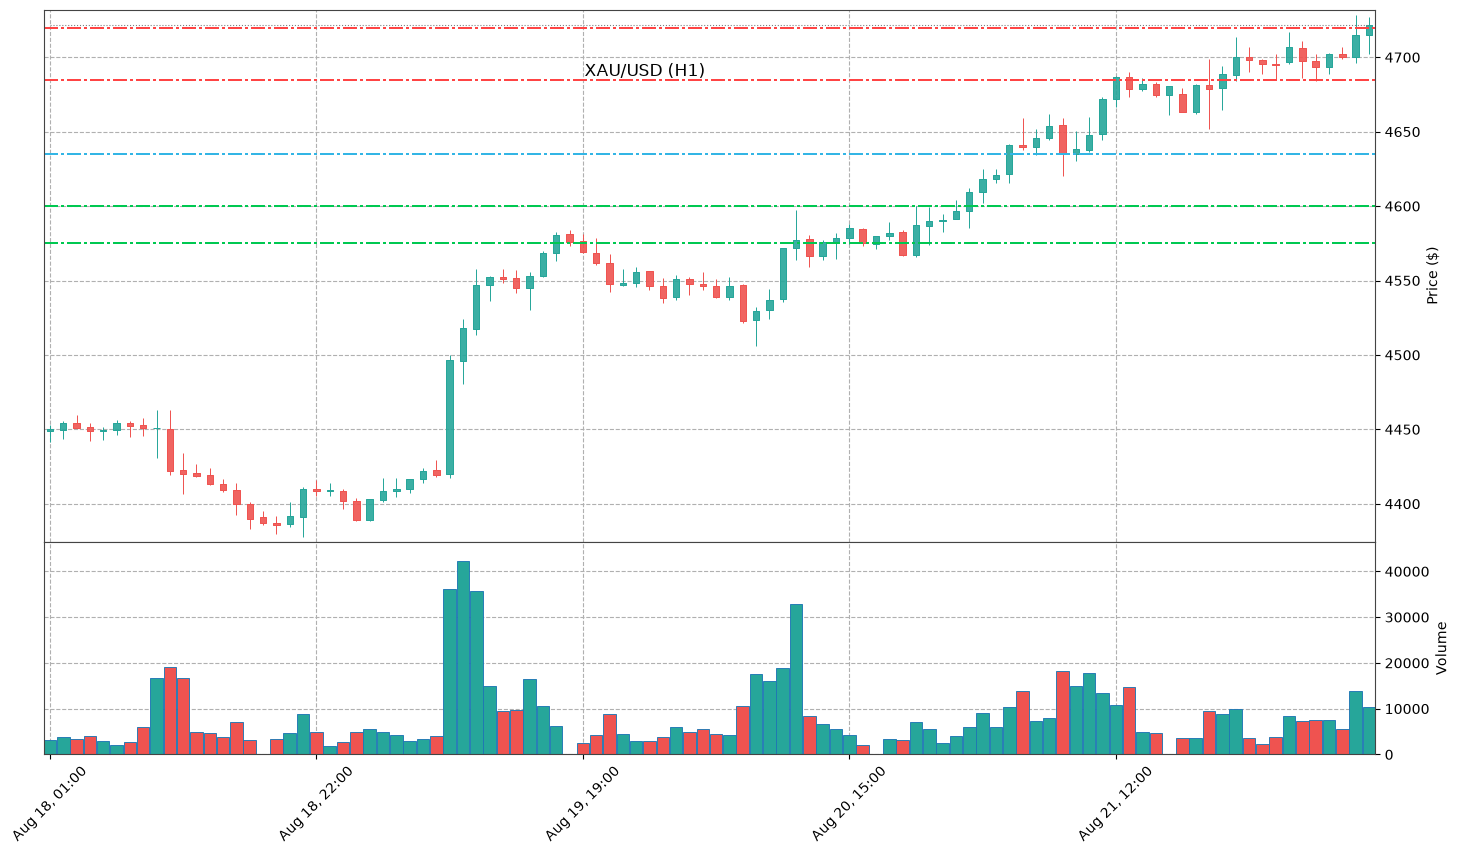
Gold is currently exhibiting a classic bullish breakout phase. After a period of consolidation, the pair breached the 200-day moving average with significant volume. The real-time price of $4,673.63 is trading near the session high of $4,673.94, suggesting that “buy-the-dip” appetite remains unsatisfied.
The intraday range—spanning from a low of $4,594.95 to current levels—indicates a complete absorption of selling pressure near the $4,600 handle. With the price comfortably above the previous close of $4,603.13, the technical bias remains firmly skewed to the upside. The next major technical objective for bulls is the psychological $4,700 mark, with long-term forecasts now eyeing the $4,891 corridor.
Fundamental Context: Geopolitics vs. Fed Policy
The fundamental narrative is currently dominated by two pillars: Geopolitical Risk and Fiscal Policy.
- Geopolitical Risk: Tensions in the Middle East, specifically involving Iran, have reignited the “war premium” in precious metals. Despite a cooling in US inflation (CPI/PPI), the threat of energy supply disruptions is keeping inflation expectations sticky, which historically benefits Gold.
- The Dollar & Yields: The US Dollar Index (DXY) is struggling to maintain footing below the 99.00 level. Treasury Secretary Scott Bessent’s comments regarding fiscal consolidation and increased Treasury buybacks have signaled a potential cap on yields, reducing the opportunity cost of holding Gold.
- Economic Data Mixed: While the S&P Global Services PMI surprised at 56.8, the Manufacturing PMI’s slide to a five-month low (53.2) highlights a “two-speed” economy. This divergence suggests the Federal Reserve may be hesitant to resume aggressive hawkishness, fueling bets for a more neutral stance at the upcoming Jackson Hole symposium.
Key Technical Levels
- Resistance 2 (R2): $4,720 (Projected Fibonacci Extension)
- Resistance 1 (R1): $4,685 (Current Trendline Resistance)
- Pivot Point: $4,635
- Support 1 (S1): $4,600 (Major Breakout Zone/Psychological)
- Support 2 (S2): $4,575 (Weekly Low)
The “4-Hour Edge”
Outlook: Bullish
For the next 4-hour window, we expect the momentum to persist. The proximity of the current price to the daily high indicates a lack of distribution. Traders should watch for a brief consolidation above $4,660 before a secondary push toward $4,690. Only a sustained drop back below the $4,620 level would neutralize the current intraday bullish bias.
Strategy: Look for long entries on minor pullbacks toward the $4,655 zone, targeting $4,695 with a tight stop-loss below $4,630.
Disclaimer: Precious metals trading involves significant risk and may not be suitable for all investors. The high degree of leverage can work against you as well as for you. Before deciding to trade, you should carefully consider your investment objectives and risk appetite.
