Gold Slumps Toward $4,000: Geopolitical Volatility and Hawkish Fed Trigger Massive Liquidation
Executive Summary
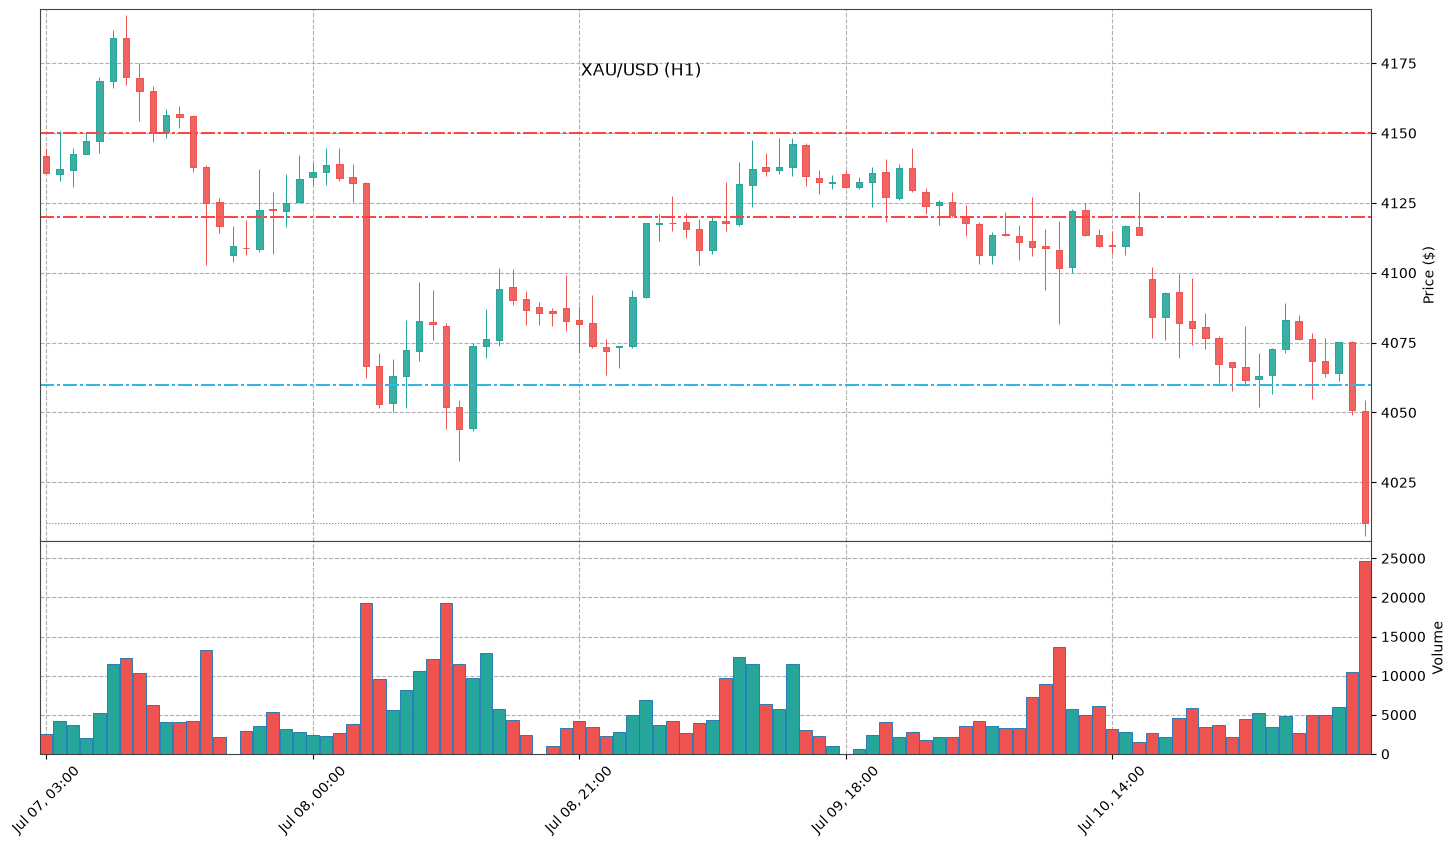
- Massive Intraday Correction: Gold (XAU/USD) has plummeted 2.69% ($110.67) in a single session, crashing from an open of $4,120.51 to test the critical psychological support level of $4,000.
- Inflationary War Premium: Contrary to the typical “safe-haven” rally, escalating tensions in the Middle East—including US strikes on Iran—have spiked oil prices by over 5%, leading markets to price in a more aggressive Federal Reserve to combat energy-driven inflation.
- Liquidity Event: Technical indicators suggest a “stop-loss liquidation positioning reset,” as the breach of the $4,100 level triggered a cascade of sell orders amid a hawkish shift in FOMC sentiment.
Technical & Fundamental Breakdown
The Fundamental Shift: War vs. Rates The current price action in XAU/USD represents a complex decoupling from traditional safe-haven behavior. While the US military confirms strikes on Iran and President Trump declares the interim peace agreement “over,” the market’s primary focus has shifted to the inflationary consequences. Higher energy costs resulting from the potential blockade of the Strait of Hormuz are expected to keep US interest rates elevated for longer.
The latest FOMC minutes underscore this concern, showing a Fed united on maintaining a restrictive stance. With the market now pricing in at least one more rate hike by year-end, the opportunity cost of holding non-yielding bullion has surged, forcing gold ETFs into a liquidation phase.
Technical Analysis: Breaking the Floor Technically, Gold has entered a sharp reversal phase. After failing to sustain levels above the $4,120 resistance (today’s high and previous close), the metal sliced through the 200-day moving average support.
The intraday low of $4,000.54 serves as the current line in the sand. A sustained break below $4,000 would signal a shift from a “correction” to a “bearish trend,” potentially opening the door to the $3,950 zone. Conversely, the massive $110 drop has pushed the Relative Strength Index (RSI) into oversold territory, suggesting that while the macro trend is heavy, a short-term “dead cat bounce” or consolidation is overdue.
Key Technical Levels
- Resistance 2 (R2): $4,150 (Major supply zone)
- Resistance 1 (R1): $4,120 (Pivot high and daily open)
- Pivot Point: $4,060 (Key intraday retracement level)
- Support 1 (S1): $4,000 (Psychological floor and daily low)
- Support 2 (S2): $3,950 (Structural long-term support)
The “4-Hour Edge”
Outlook: Bearish/Neutral
For the next 4 hours, expect consolidation with a bearish bias. The market is currently reeling from a “positioning reset.” While the $4,000 level is likely to provide some temporary support due to profit-taking by short-sellers, the fundamental backdrop—rising oil, hawkish Fed, and geopolitical uncertainty—favors selling on any minor rallies.
Investors should watch the $4,030 level closely; a failure to reclaim this on a 4-hour close will likely invite a second wave of selling toward $3,985. We do not anticipate a full recovery of today’s losses until the “inflation shock” from the energy sector is fully digested.
Disclaimer: This analysis is for informational purposes only and does not constitute financial advice. Trading precious metals involves significant risk of loss. Always consult with a certified financial advisor before making investment decisions.
