XAU/USD Surges Beyond $4,350: Peace Deal Triggers “Rate Relief” Rally
Executive Summary
- Geopolitical Pivot: Gold has surged 3.26% following a landmark US-Iran peace agreement, shifting market focus from “safe-haven” demand to “rate relief” as oil prices collapse.
- Bullish Momentum: The XAU/USD pair has shattered previous resistance at $4,300, hitting an intraday high of $4,369.48 as traders price in a more dovish Federal Reserve under Chair Kevin Warsh.
- Technical Breakout: Following a month of consolidation near the $4,000 support, Gold has entered a decisive breakout phase, fueled by easing inflation expectations and a weaker manufacturing outlook.
Technical & Fundamental Breakdown
Fundamental Catalyst: The “Hormuz Peace” Effect
The precious metals market has undergone a dramatic transformation in the last 24 hours. Historically, peace agreements diminish gold’s safe-haven appeal. However, the June 15th announcement of the US-Iran pact in Switzerland has produced a counter-intuitive bullish response. By reopening the Strait of Hormuz, oil prices have plummeted to two-month lows. This has significantly cooled global inflation fears, providing the Federal Reserve with the “breathing room” to maintain interest rates at 3.75% rather than pursuing further hikes.
Under the new leadership of Chair Kevin Warsh, the market is betting on a “steady-hand” policy. With the Empire State Manufacturing survey falling to 5.7 and US inflation currently at 4.2%, the macro-environment is transitioning from “inflation-hedging” to “yield-scarcity,” which is traditionally beneficial for non-yielding bullion.
Technical Analysis: Vertical Momentum
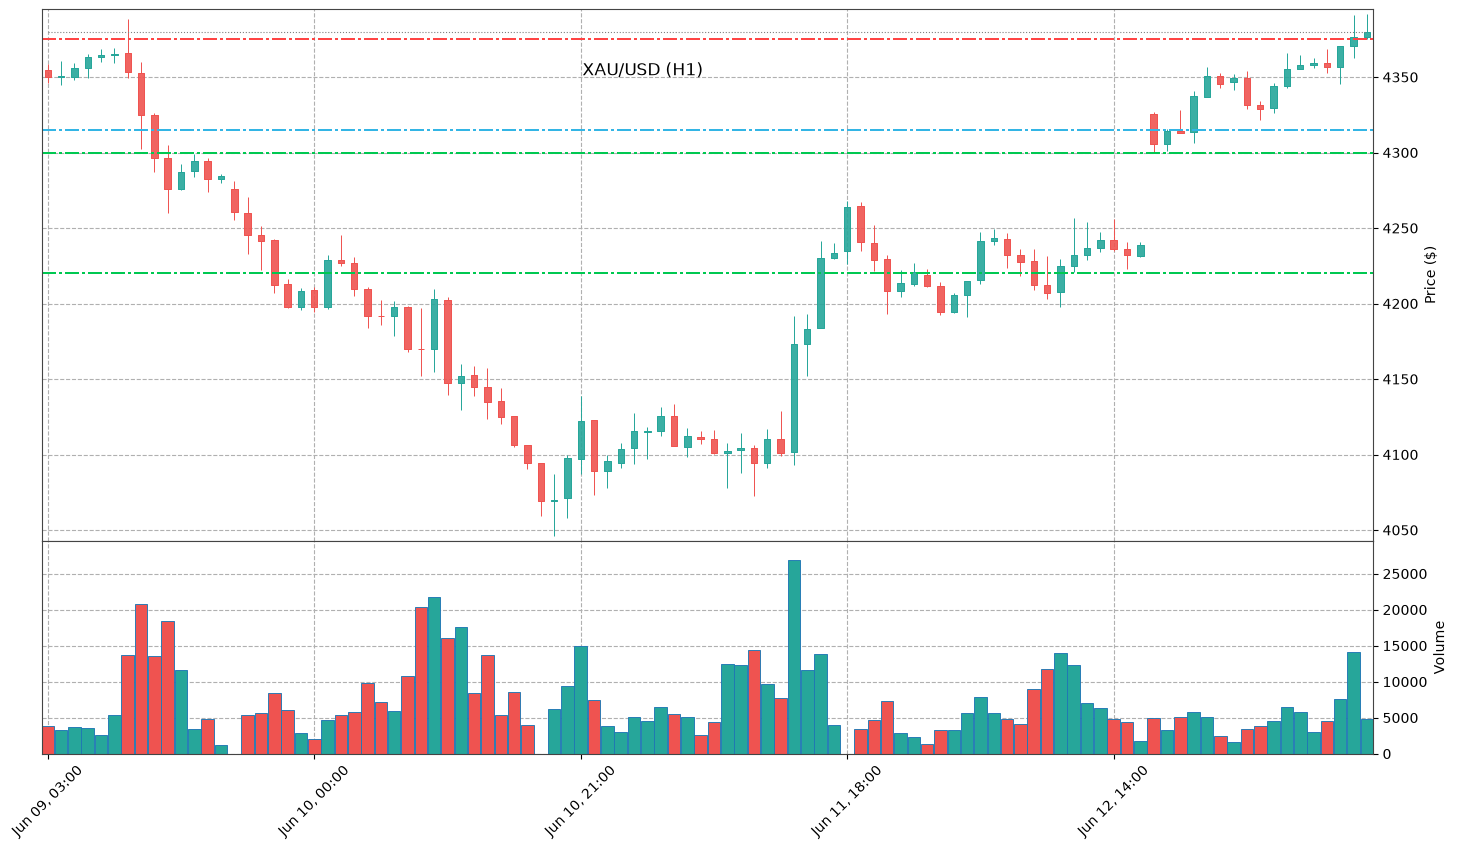
From a technical standpoint, XAU/USD is in a clear breakout phase. The market opened at $4,219.39 and saw immediate, aggressive buying pressure that pushed the price through the $4,300 psychological barrier.
The intraday range ($4,219.39 – $4,369.48) represents a massive 3.26% expansion. This move has effectively neutralized the bearish sentiment that had seen gold fall 4.49% over the previous month. We are now seeing “monster comeback” characteristics, where the previous resistance at $4,300 will likely flip to become a primary support level.
Key Technical Levels
The market is currently testing the $4,370 ceiling. A sustained close above this level on the 4-hour chart would open the door for a run toward the $4,400 psychological resistance.
- Resistance 2 (R2): $4,410 (Next major extension)
- Resistance 1 (R1): $4,375 (Intraday peak cluster)
- Pivot Point: $4,315 (Mid-range equilibrium)
- Support 1 (S1): $4,300 (Psychological floor/Previous resistance)
- Support 2 (S2): $4,220 (Day low and volume origin)
The “4-Hour Edge”
Outlook: Bullish (Short-term Consolidation)
For the next four hours, I maintain a Bullish outlook with a caveat for minor profit-taking. The momentum is currently vertical, and while some “cooling off” near the $4,370 mark is expected, the underlying fundamental shift (lower oil/lower yields) is too strong to ignore. Look for the $4,345 - $4,350 zone to act as a launchpad for a re-test of the daily highs before the close of the New York session.
Trading Stance: Long on dips toward $4,345, targeting $4,385 with a tight stop-loss below the $4,315 pivot.
Disclaimer
This analysis is for informational purposes only and does not constitute financial advice. Trading precious metals involves significant risk of loss. Always consult with a certified financial advisor before making investment decisions.