Gold Under Pressure: Hormuz Blockade and Inflationary Fears Rattles XAU/USD
Executive Summary
- Geopolitical Volatility: Gold prices experienced sharp intraday swings, dropping toward $4,700 as the U.S. announcement of a blockade on the Strait of Hormuz sent shockwaves through global energy markets.
- Inflation vs. Interest Rates: While surging oil prices (WTI approaching $100) typically act as a tailwind for bullion, the resulting inflation spike is fueling expectations of a “higher-for-longer” Fed policy, capping gold’s upside.
- Technical Rebound: After hitting a session low of $4,644, XAU/USD has staged a modest recovery to $4,712, though it remains down 0.78% on the day.
Technical & Fundamental Breakdown
Fundamental Context: The Geopolitical Tug-of-War The gold market is currently caught in a complex crosscurrent. On one side, the failed negotiations in Pakistan and the subsequent U.S. naval blockade of Iranian ports have heightened “safe-haven” demand. On the other, the 7% surge in crude oil is a double-edged sword. While gold is a classic hedge against inflation, the market is pricing in a more aggressive Federal Reserve. If energy costs drive headline CPI higher, the probability of interest rate cuts in 2026 diminishes, increasing the opportunity cost of holding non-yielding gold.
Technical Analysis: Volatile Consolidation Today’s price action reveals a market in a state of volatile consolidation with a bearish bias. Opening at $4,749.44, the pair plummeted to a low of $4,644.52—a significant liquidity grab—before rebounding back above the $4,700 psychological level.
The fact that Gold is trading nearly 6% lower than last month, and significantly below its January 2026 all-time high of $5,608, suggests we are in a corrective phase within a long-term bullish super-cycle. The current “dead cat bounce” from the $4,644 support level indicates that buyers are active at these depths, but the lack of follow-through above $4,750 suggests exhaustion among bulls.
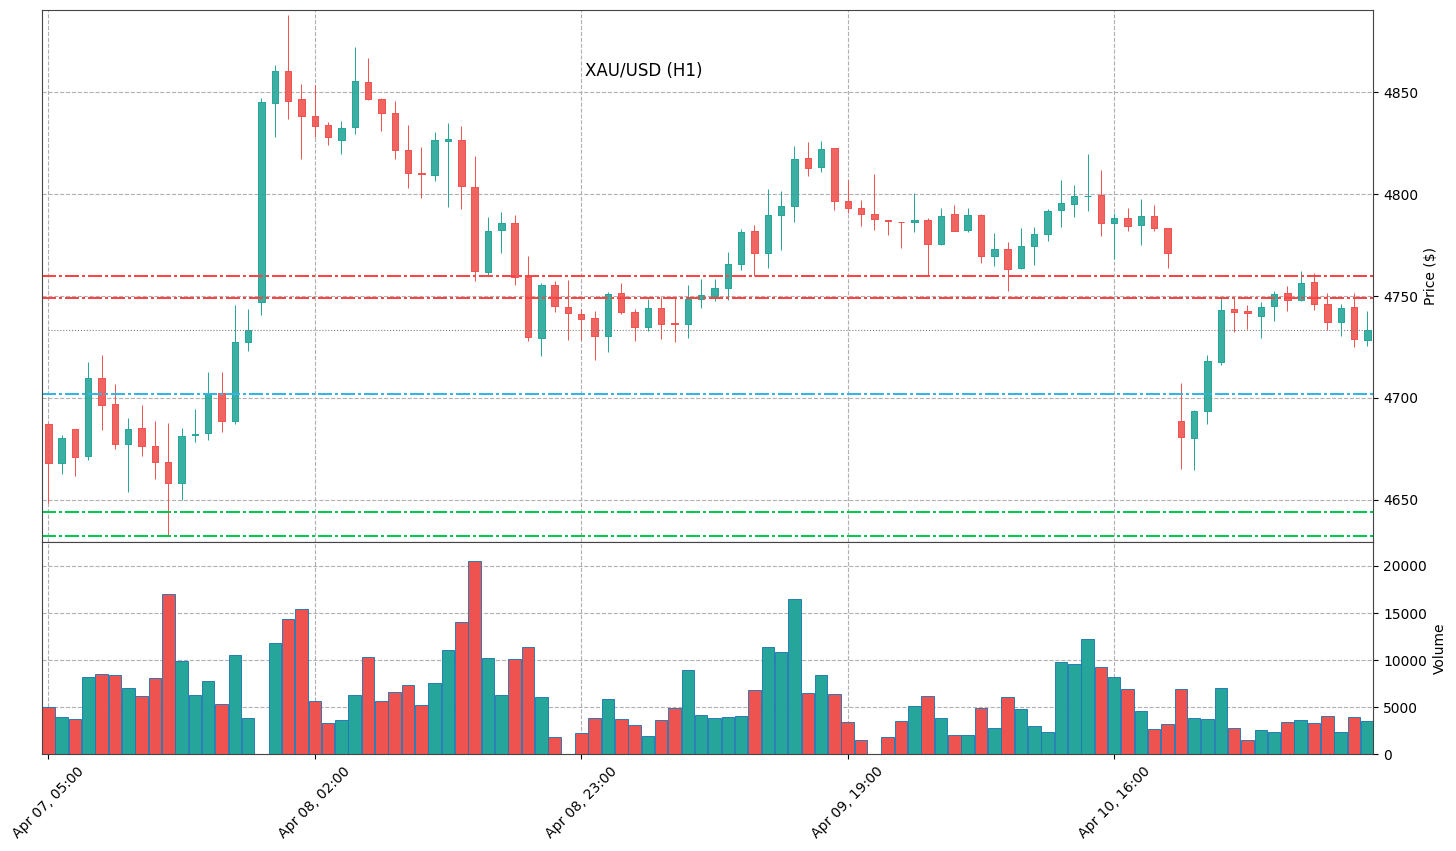
Key Technical Levels
- Resistance 2 (R2): $4,760 (Previous stability zone and intraday ceiling)
- Resistance 1 (R1): $4,749 (Daily Open / High)
- Pivot Point: $4,702 (Concentration of current volume)
- Support 1 (S1): $4,644 (Intraday Low)
- Support 2 (S2): $4,632 (Four-day trough and critical structural support)
The “4-Hour Edge”
Outlook: Neutral-to-Bearish
For the next four hours, expect XAU/USD to oscillate within a tight range between $4,690 and $4,725. While the initial shock of the Strait of Hormuz news has been digested, the 10:00 AM Eastern Time implementation of the blockade will be the next major volatility catalyst.
Unless we see a significant pullback in the U.S. Dollar or a cooling of energy prices, the path of least resistance remains to the downside. Traders should watch the $4,700 level closely; a sustained break below this could trigger a retest of the $4,644 liquidity pocket.
Disclaimer: This analysis is provided for informational purposes only and does not constitute investment advice. Trading precious metals involves significant risk of loss. Always conduct your own research or consult with a licensed financial advisor before making any trading decisions.